Timing the Market vs Time in the Market: A Comprehensive Analysis
Your gut feeling about the market is probably wrong. Discover why human emotion is the enemy of returns, and learn the few specific scenarios where paying attention to valuation metrics and market cycles actually pays off.
What is Market Timing?
We have all felt the temptation to sit on the sidelines when the market looks shaky.
You are holding some dry powder in cash, and a little voice whispers, "Just wait until it drops another 10% before you buy."
Alternatively, maybe you own stocks or real estate that have had a massive run-up, and you feel the urge to sell before the inevitable crash.
This is market timing, the active attempt to predict future price movements to avoid losses and maximize gains.
The goal is incredibly seductive because it seems so intuitive:
•
Buy at the absolute bottom.
•
Sell at the absolute top.
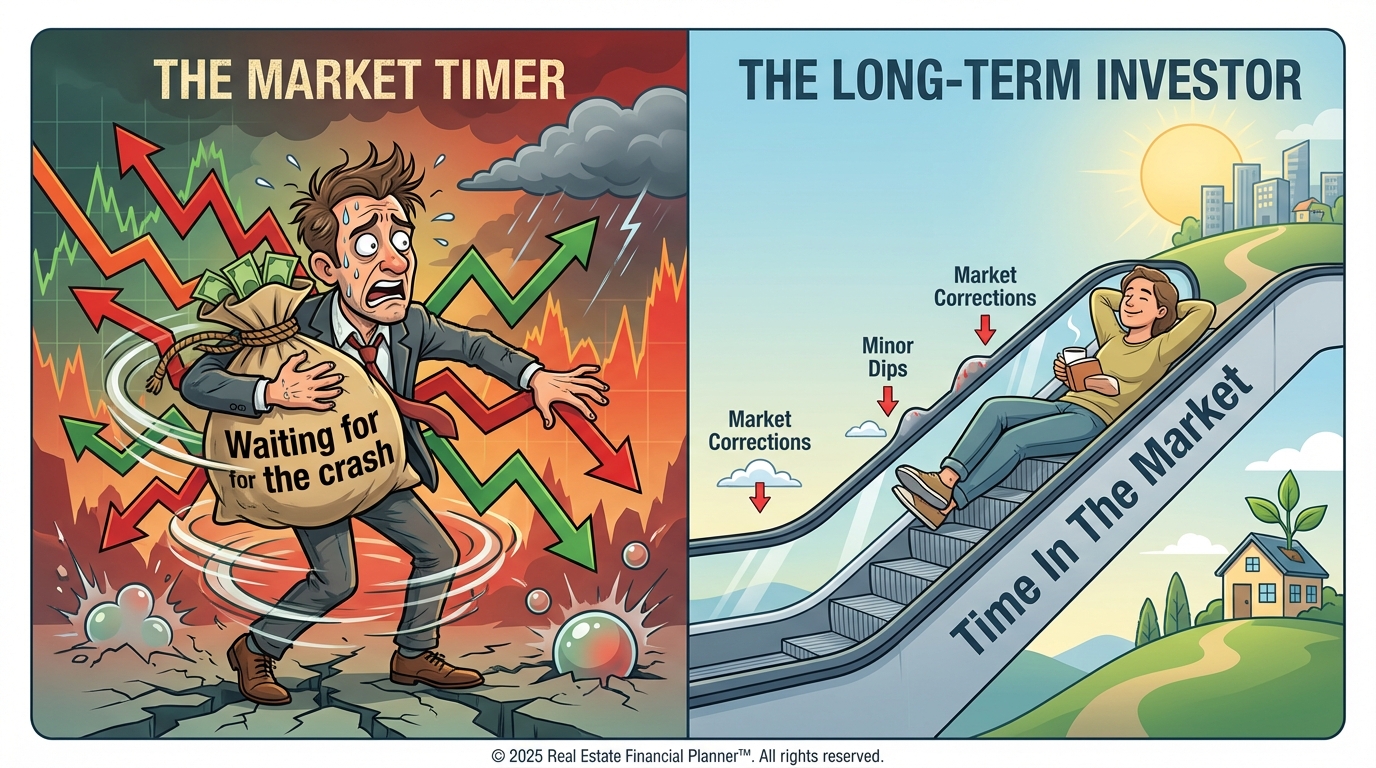
However, this strategy stands in stark contrast to the proven concept of "time in the market."
Time in the market means holding high-quality assets through the inevitable ups and downs, rather than jumping in and out to catch the waves.
It is the difference between being a relaxed passenger on a long train ride and trying to jump onto that moving train at full speed.
The Efficient Market Hypothesis (EMH) vs. Active Management
There is a massive philosophical divide in the financial world regarding whether timing is even possible.
I have sat in university lecture halls listening to brilliant professors explain the Efficient Market Hypothesis (EMH).
This theory argues that current asset prices already reflect all available information, meaning stocks or real estate are almost always fairly priced.
According to strict EMH, trying to beat the market is just luck, not skill.
But when I step out of the classroom and talk to active traders and real estate investors, they scoff at this academic idea.
They see distinct inefficiencies that the professors ignore:
•
Fear in the marketplace causing panicked selling.
•
Greed driving irrational bidding wars.
•
Reactionary behavior based on temporary news headlines.
These active managers believe markets are inherently inefficient because human emotion creates distinct opportunities to buy low.
In my experience, the truth usually lies somewhere in the messy middle between perfect efficiency and chaotic emotion.

The Costs of Being Wrong
This is where the rubber meets the road, and I learned this lesson the hard way early in my investing career.
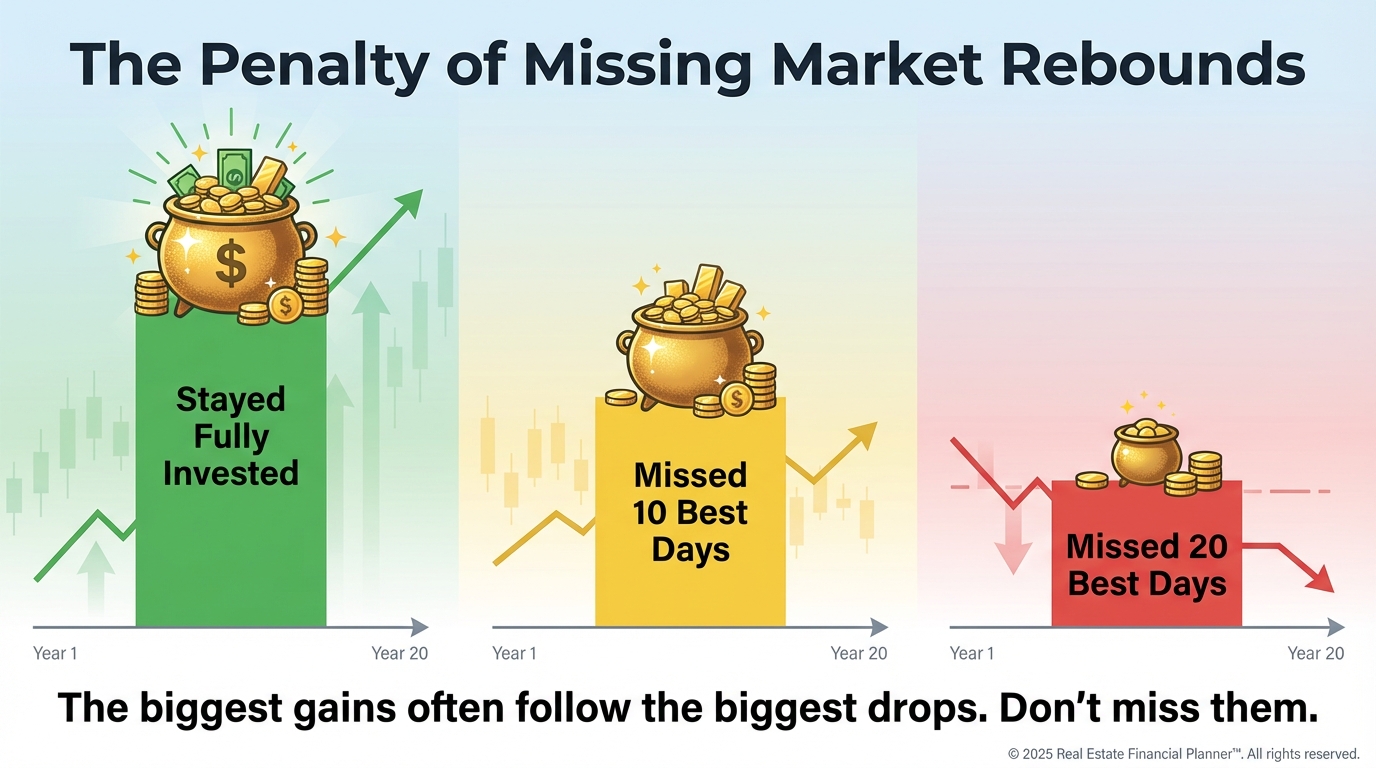
It feels much safer to sit on the sidelines during a crisis, but the market’s biggest gains often happen immediately after the biggest drops.
If you blink, you miss them.
There is famous data showing that if you miss just the 10 best trading days over a 20-year period, your returns get decimated.
Being out of the market on those few critical recovery days can cut your long-term wealth in half.
But the cost of timing isn't just about missed gains; it is also about friction.
Every time you sell an asset to "time" a drop, you trigger real costs:
•
Transaction fees and commissions.
•
Real estate closing costs.
These costs eat away at your compounding returns like termites in a foundation.
To win at market timing, you have to be right twice: you must sell at the top and buy back in at the bottom.
Getting one right is hard, but getting both right consistently is nearly impossible.
Market Timing in the Stock & Options World
Now that we have covered the fundamentals, let's look at the specific tools traders use to time the stock market.
While perfect timing is impossible, certain indicators can help us gauge probability and risk.
There is no crystal ball, but there are definitely weather reports for the market.
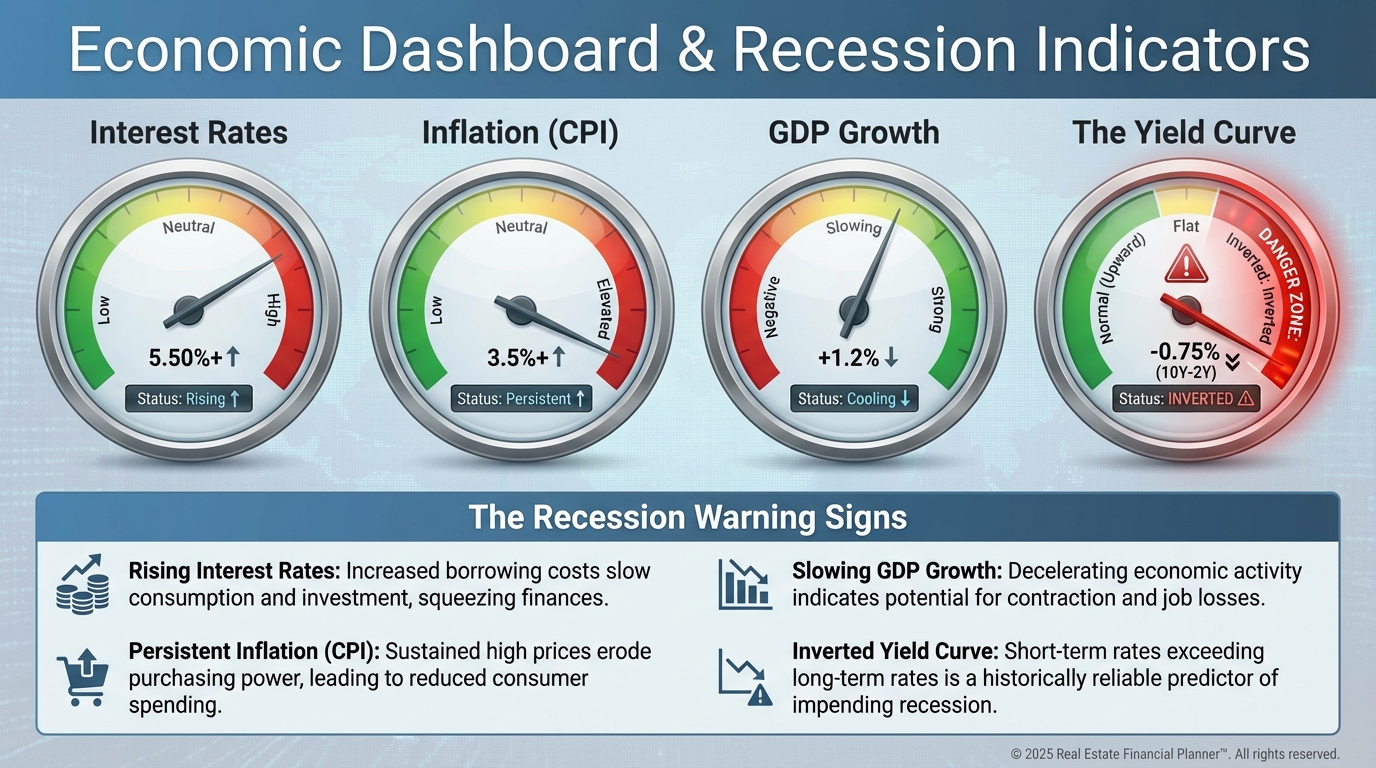
Macro-Economic Indicators
The broader economy sets the tide for the stock market, and you cannot fight the tide.
Smart investors keep a close eye on interest rates, inflation (CPI), and Gross Domestic Product (GDP).
The most reliable recession predictor in history is the Yield Curve.
Normally, long-term bonds pay higher interest than short-term bonds, but when that flips—and short-term rates are higher—it is called an "inverted yield curve."
Historically, an inverted yield curve has predicted almost every recession in the last 50 years, signaling that it might be time to get defensive with your options strategies.
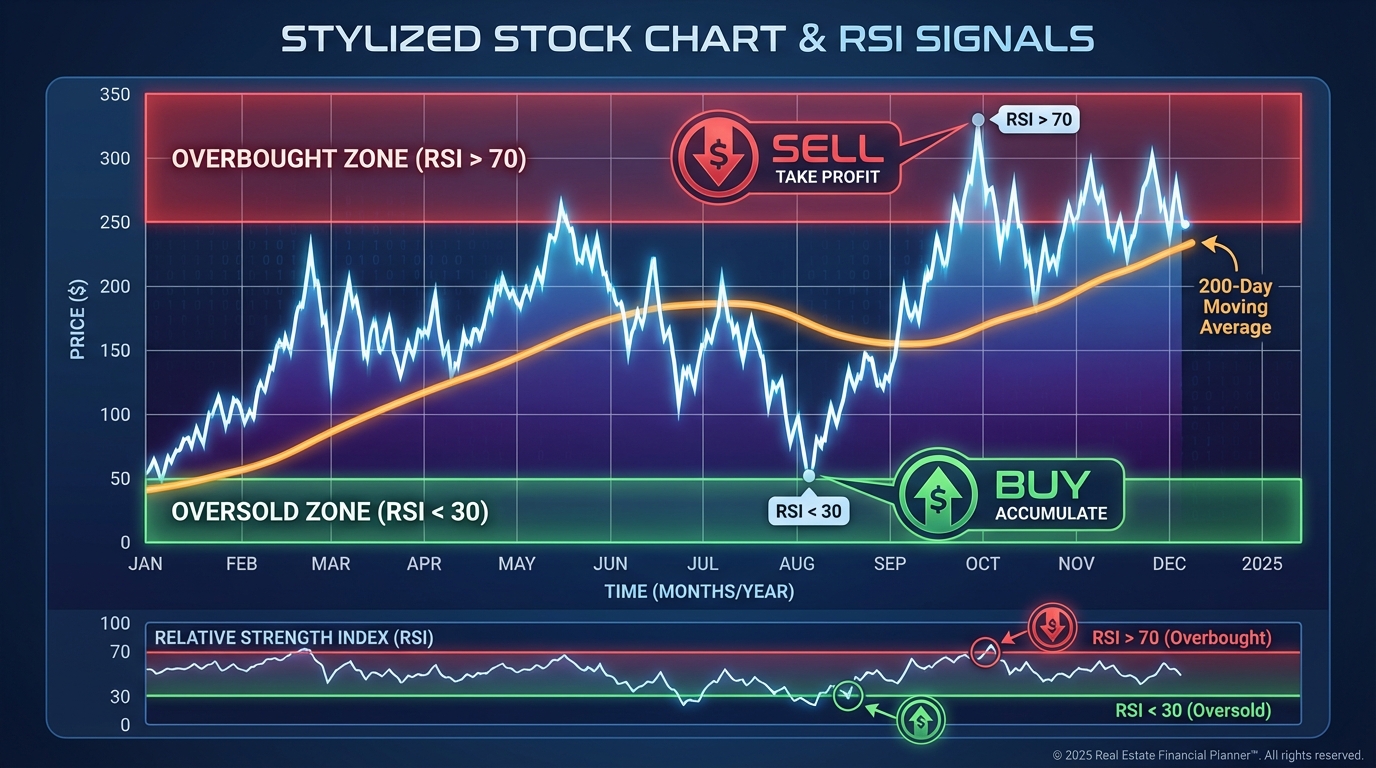
Technical Analysis & Chart Patterns
While macroeconomics looks at the big picture, technical analysis looks strictly at price history.
Traders use Moving Averages (like the 50-day or 200-day) to determine the trend; if the price is above the line, the trend is up, and if it's below, the trend is down.
They also look for "overbought" or "oversold" signals using tools like the Relative Strength Index (RSI).
When the RSI goes above 70, the stock might be too expensive and due for a pullback (a good time to sell covered calls).
When it drops below 30, it might be beaten down and ready to bounce (a potential time to sell puts).
Valuation Metrics
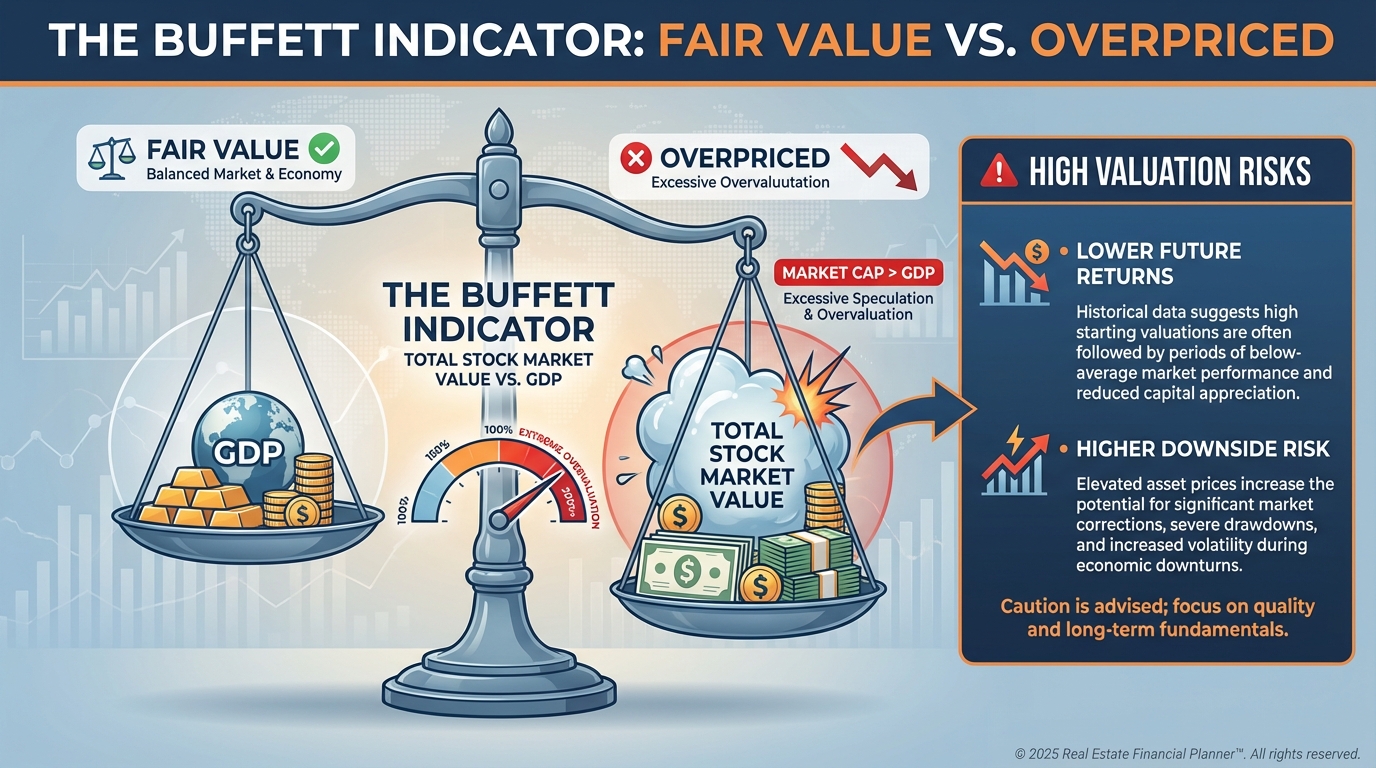
Price is what you pay, but value is what you get.
To determine if the entire market is expensive, we look at the Price-to-Earnings (P/E) ratio and the Shiller CAPE ratio.
Another favorite is the "Buffett Indicator," which compares the total value of the stock market to the GDP of the country.
When these metrics are historically high, future returns tend to be lower.
It doesn't mean a crash is imminent tomorrow, but it suggests that the easy money has already been made.
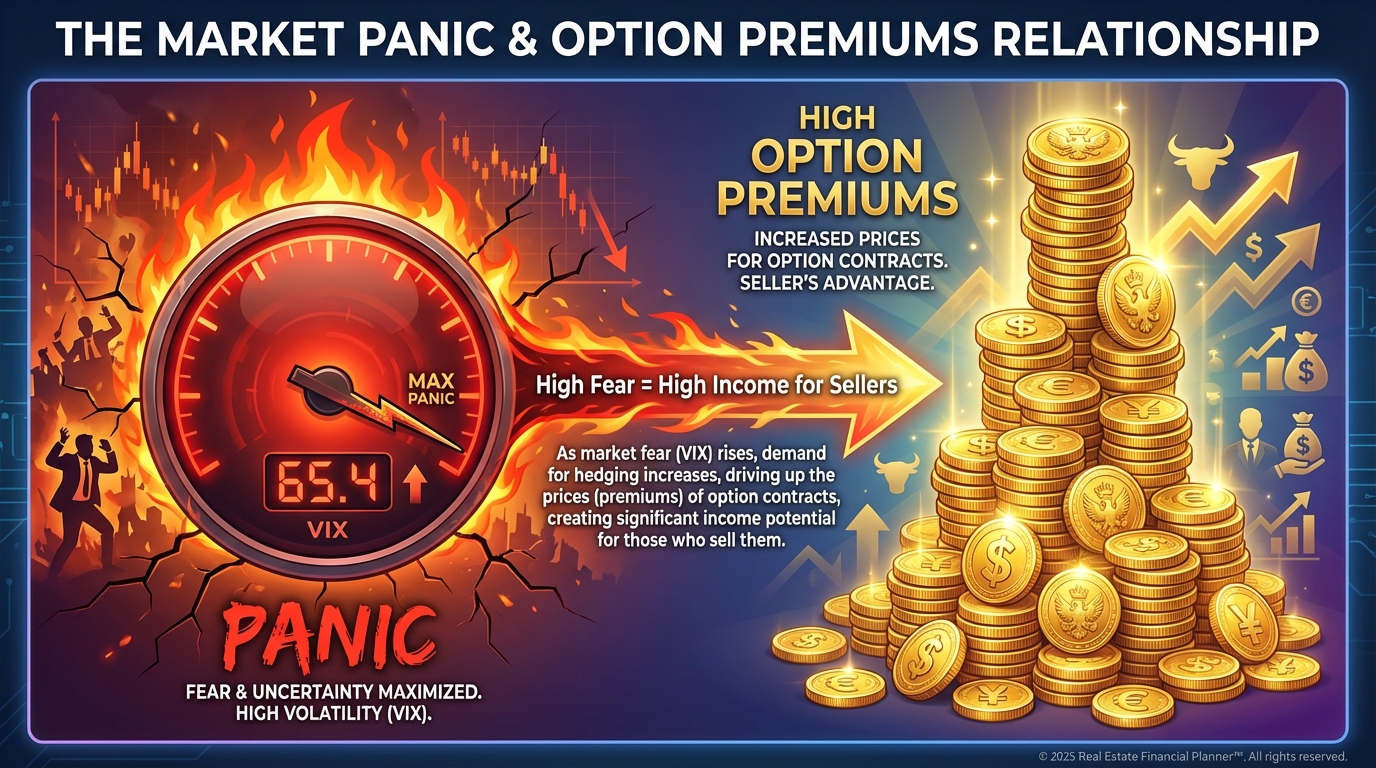
Volatility as a Timing Tool
For options traders, volatility is an asset class of its own.
We measure this using the VIX, often called the "Fear Gauge."
When the market crashes, panic sets in, and the VIX spikes.
This high volatility pumps up the premiums on options, making it an incredible time to sell cash-secured puts.
You are effectively getting paid extra to promise to buy stocks you wanted anyway, at prices that are already lower than before.
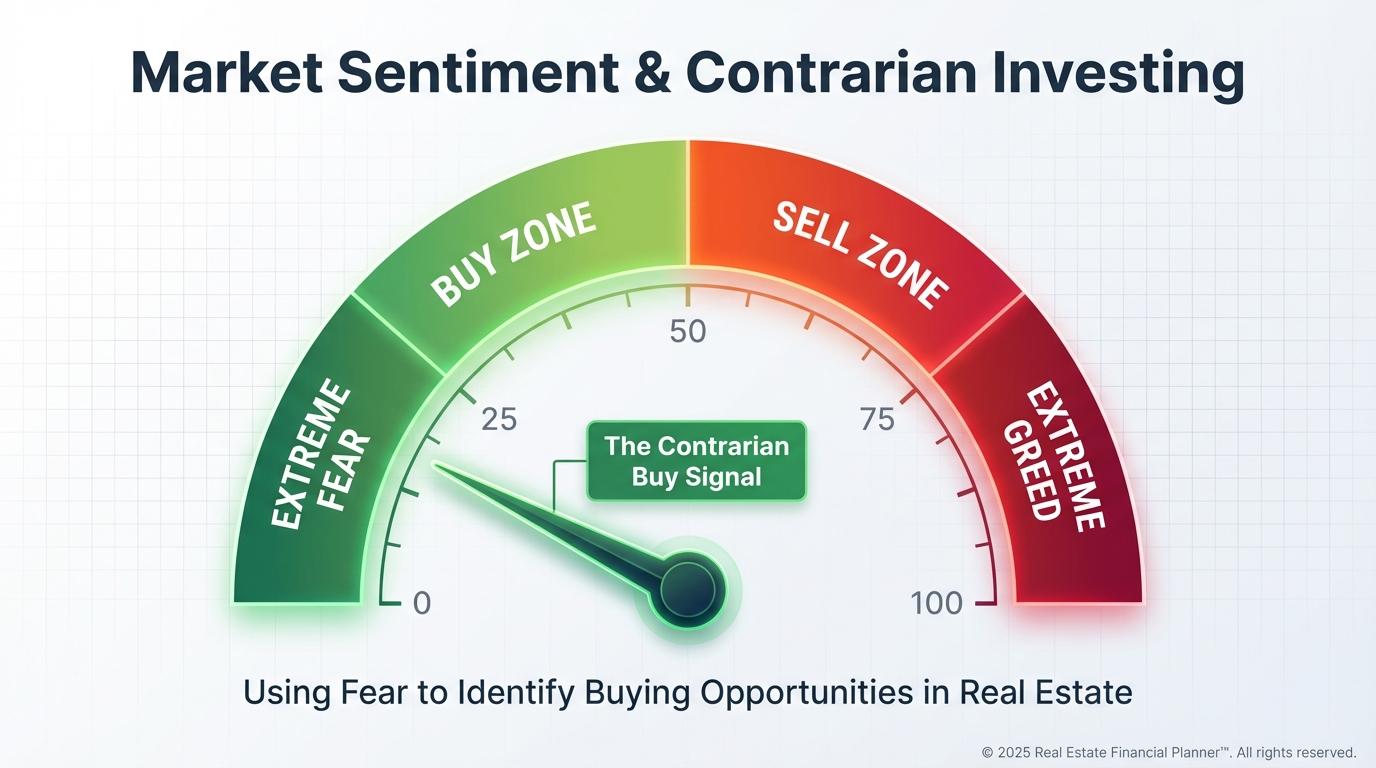
Sentiment Analysis
Finally, we have to look at the mood of the crowd.
The "Fear & Greed Index" aggregates data to tell us if investors are too bullish or too bearish.
There is a strong contrarian philosophy here: "Be fearful when others are greedy, and greedy when others are fearful."
When everyone is euphoric and buying call options, the market is often near a top.
When everyone is despondent and buying put protection, the bottom is often near.
Market Timing in Real Estate Investing
Real estate moves much slower than the stock market, but it moves with massive momentum.
You cannot day-trade houses, but you can position yourself ahead of the next major wave.
Understanding where we are in the cycle can be the difference between a life-changing investment and a decade of stagnation.
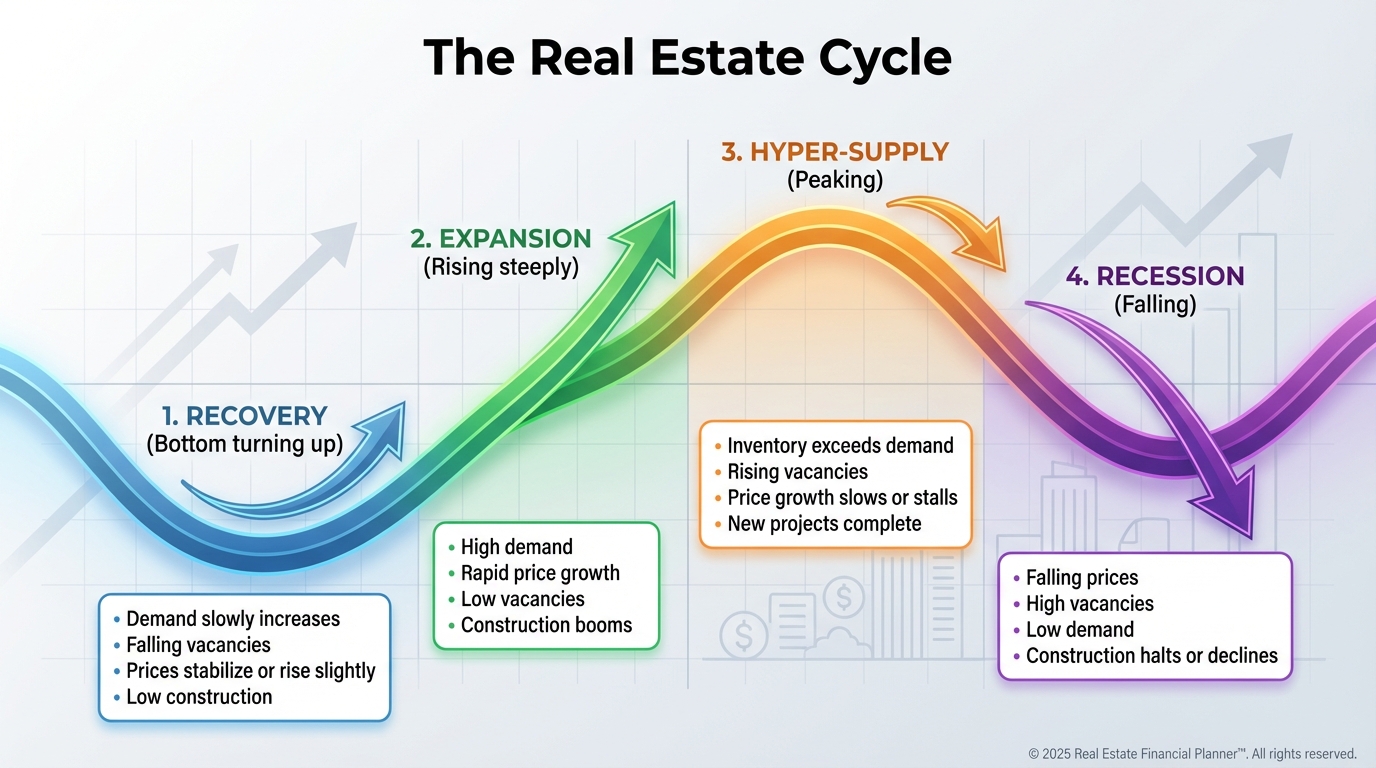
The Four Phases of the Real Estate Cycle
Real estate markets are cyclical, not linear.
They tend to follow four distinct phases: Recovery, Expansion, Hyper-Supply, and Recession.
In the Recovery phase, vacancies are high, but they stop increasing; this is often the best time to buy deeply discounted properties.
Expansion follows, where vacancies drop and rents rise; this is when most investors jump in.
Hyper-Supply happens when builders get too greedy and inventory outpaces demand.
Finally, Recession hits, prices correct, and the cycle resets.
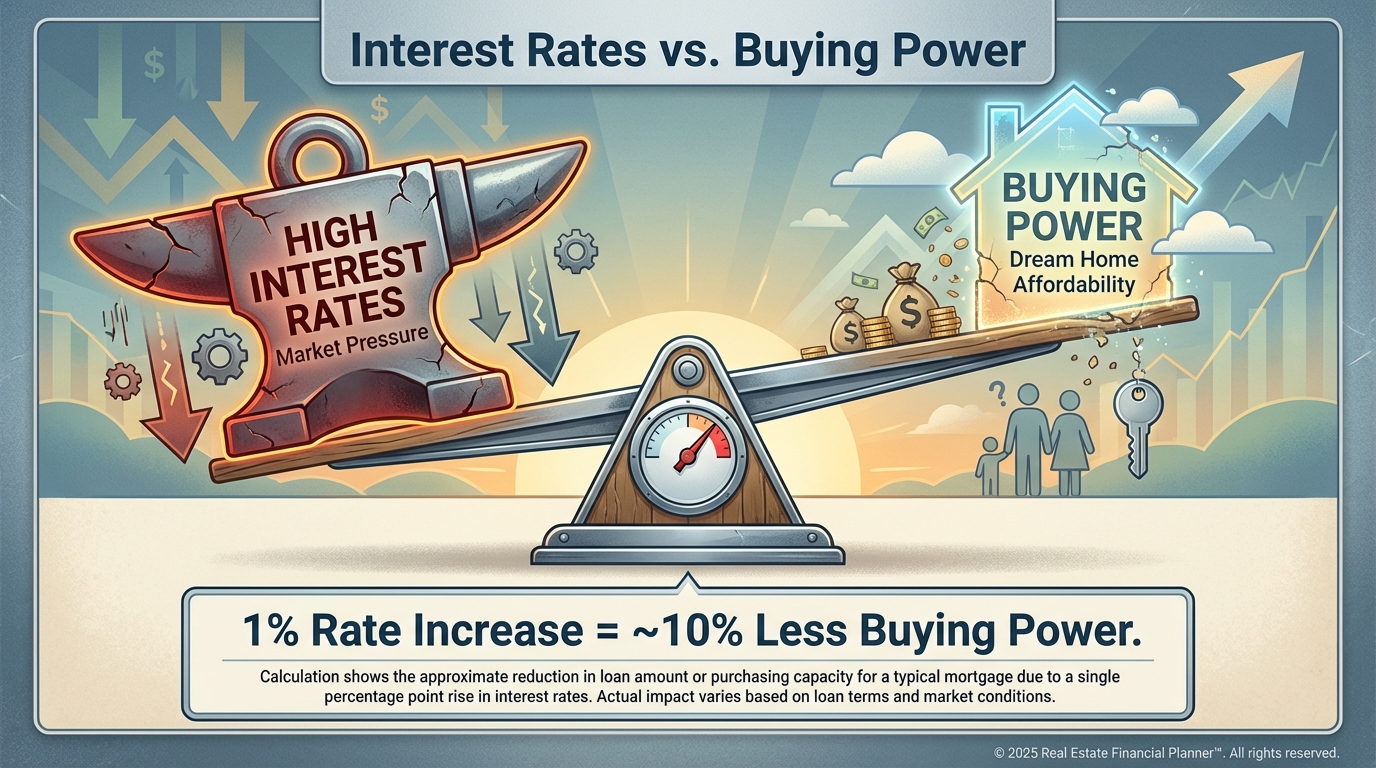
The Role of Interest Rates & Affordability
Interest rates act like gravity on real estate prices.
When the Fed raises rates, mortgage payments skyrocket, and buyer purchasing power evaporates.
Most buyers shop based on the monthly payment, not the total purchase price.
If rates double, the same monthly payment buys significantly less house.
Smart investors watch affordability indices; when housing becomes mathematically unaffordable for the average local earner, prices usually have to stagnate or fall.
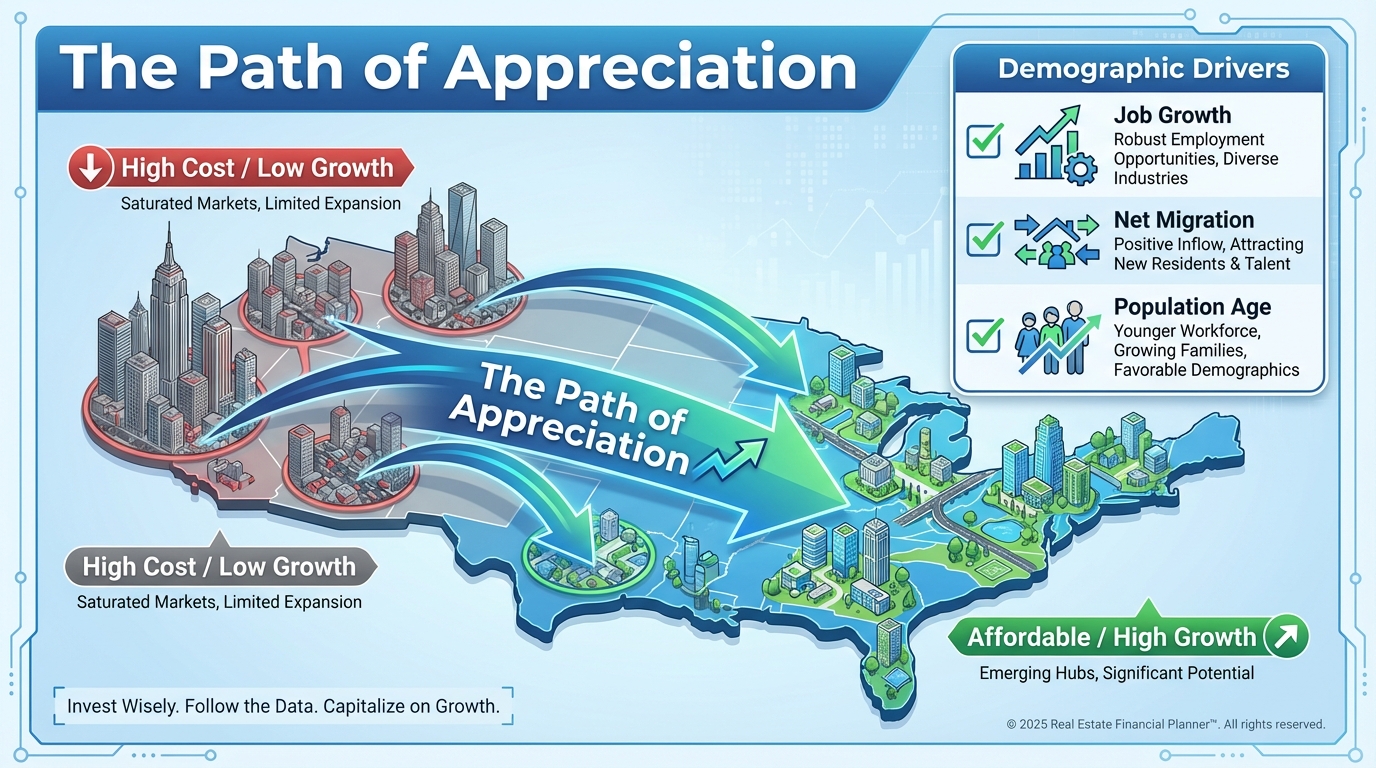
Demographics as the Long-Term Timer
You cannot time a quick flip using demographics, but you can certainly time a decade.
Real estate is ultimately about people needing a place to sleep and work.
Follow the moving vans.
If a city has positive net migration and job growth, it has a tailwind that can mask a lot of investing mistakes.
If a population is aging and shrinking, even a great property will struggle to appreciate.
Demographics are the slow-moving glacier that carves the landscape of value.
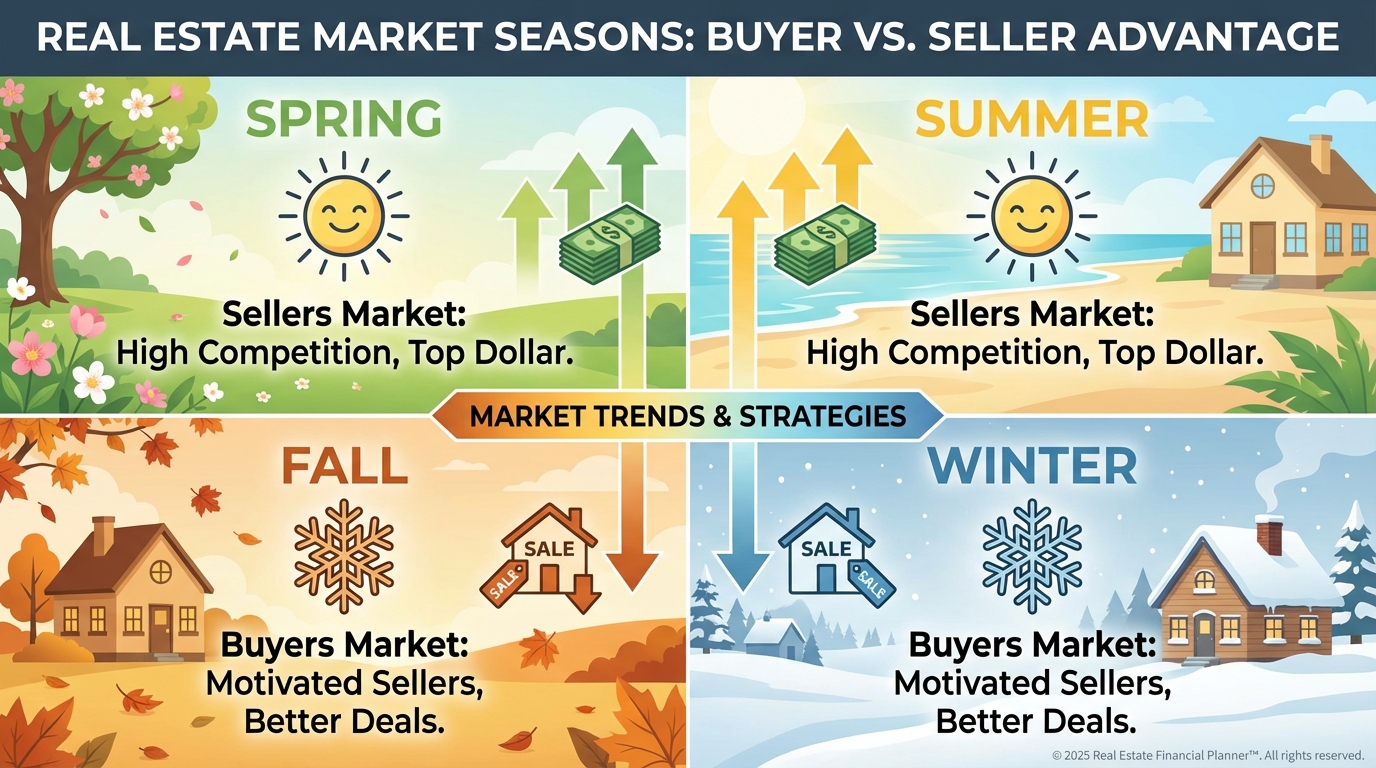
Seasonality in Real Estate
Real estate has a heartbeat that repeats every single year.
Most families want to move during the summer when school is out and the weather is nice.
This creates a distinct seasonal rhythm:
•
Spring/Summer - High inventory, high competition, higher prices (Best for Sellers).
•
Fall/Winter - Low inventory, low competition, motivated sellers (Best for Buyers).
If you want a deal, shop when it's cold, dark, and inconvenient.
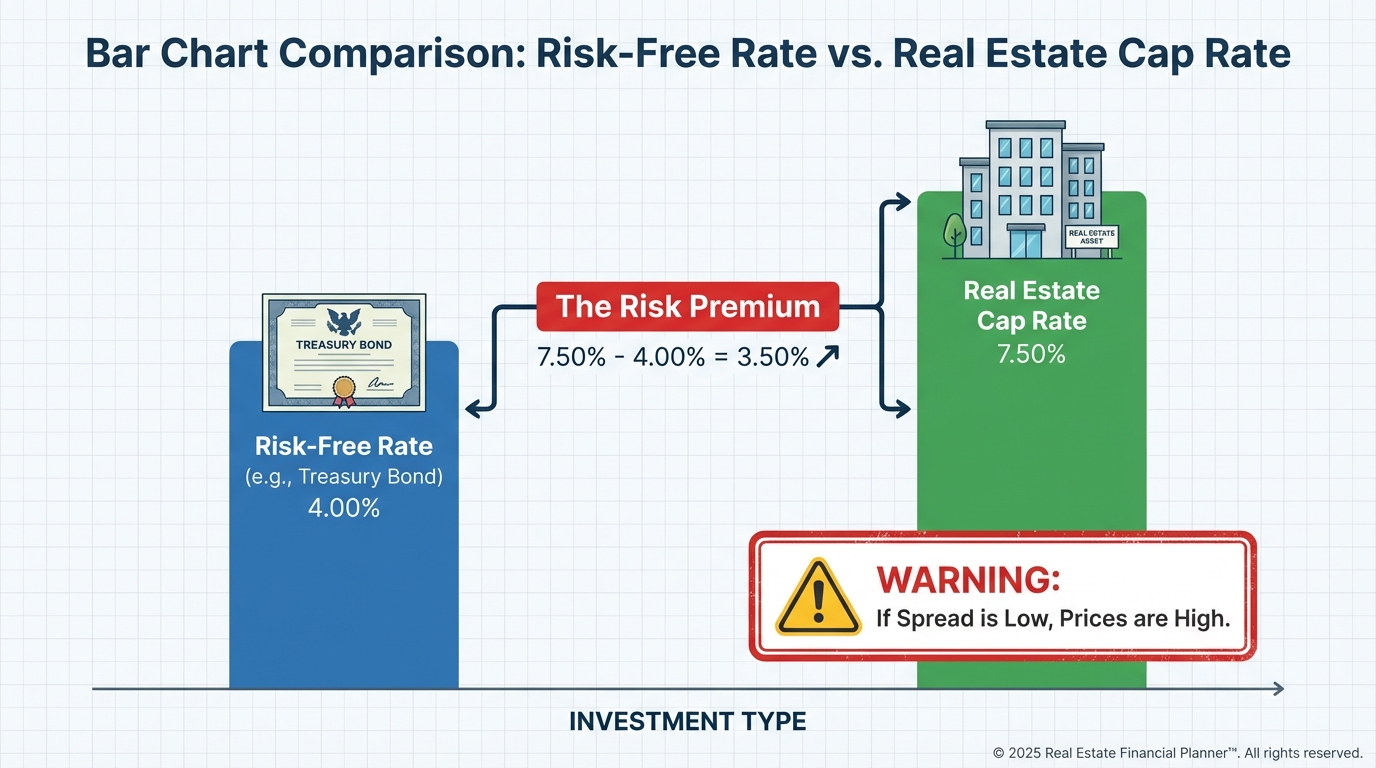
Cap Rates & Spreads
How do you know if an income property is actually a "deal"?
We look at the Cap Rate Spread.
This is the difference between the Cap Rate (the return on the property if bought for cash) and the Risk-Free Rate (like the 10-Year Treasury yield).
If you can buy a Risk-Free bond paying 5%, buying a headache-filled rental property for a 5% Cap Rate makes no sense.
Real estate should offer a "risk premium."
When that spread gets too thin—or goes negative—the market is likely overheated.
The Psychology of Timing
We like to think we are rational actors making logical decisions.
We are not.
We are emotional creatures driven by ancient survival instincts.
These instincts—fear and greed—are the primary reasons most investors fail at market timing.
Understanding your own mind is just as important as understanding the charts.
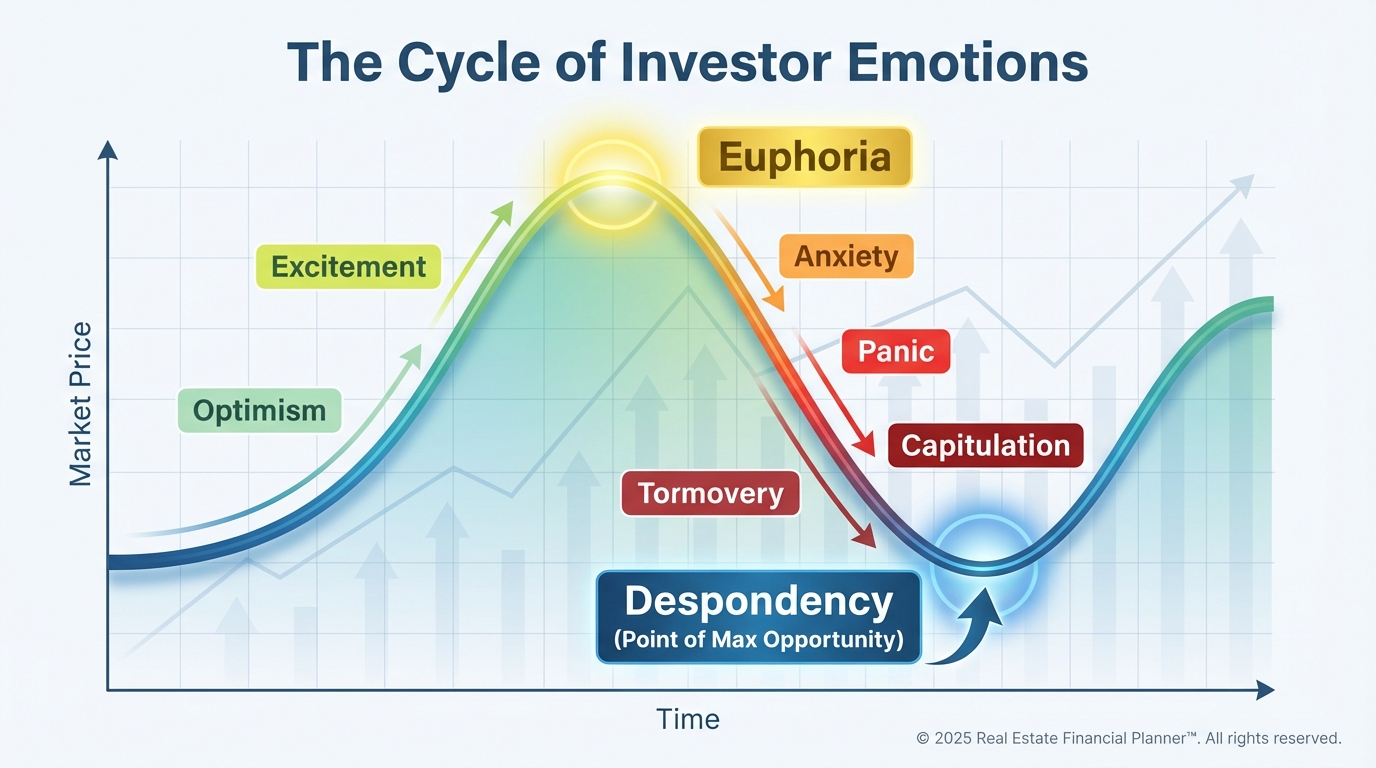
The Emotional Cycle of Investing
There is a predictable emotional path that almost every investor travels during a market cycle.
It starts with Optimism and Hope as the market rises.
As it peaks, we reach Euphoria; this is where you feel like a genius and start telling your friends how easy it is to make money.
Then the market turns.
Anxiety sets in, followed by Denial ("it will come back").
As the drop accelerates, Panic takes over.
Finally, at the absolute bottom—the point of maximum financial opportunity—investors feel Despondency and Depression.
They sell out just to stop the pain, locking in their losses right before the recovery begins.
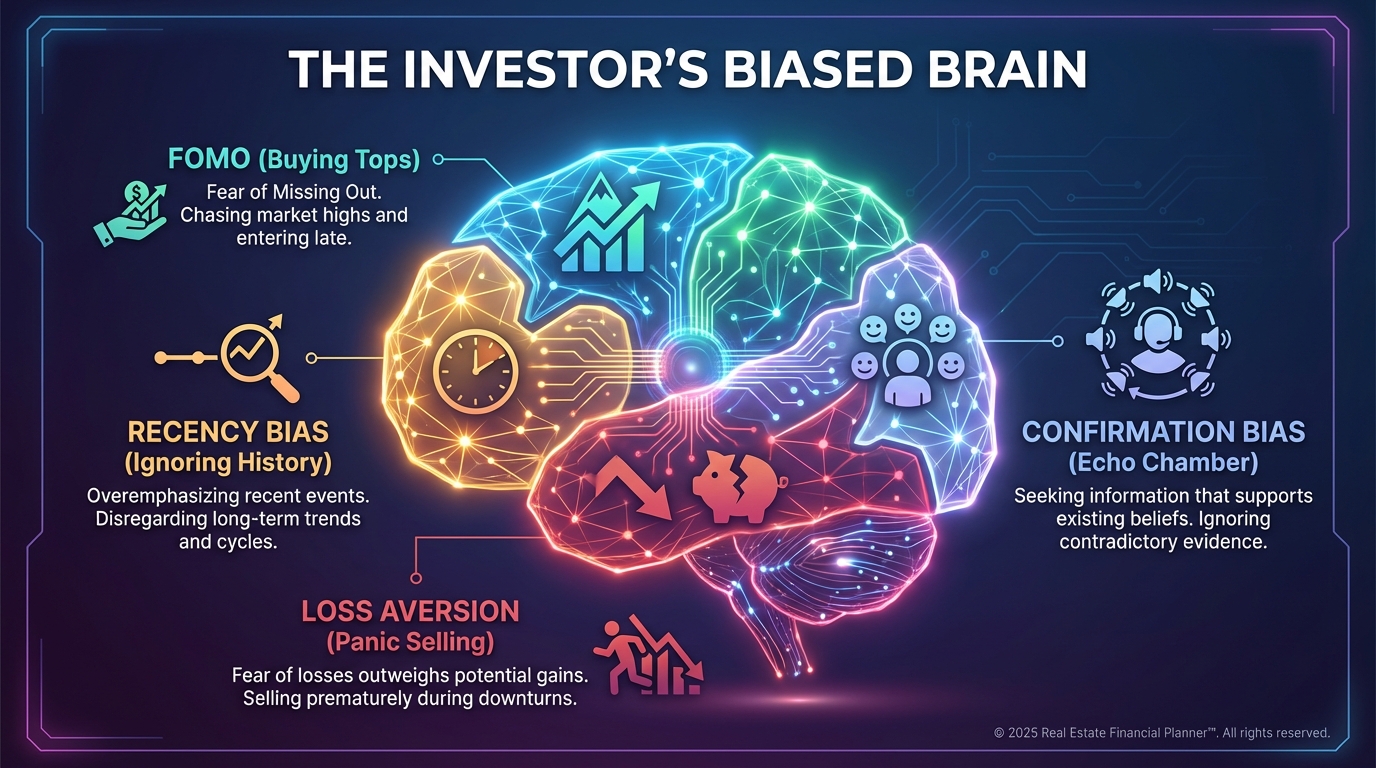
Behavioral Biases
Our brains are wired to survive on the savannah, not to trade stock options or analyze rental properties.
This leads to distinct cognitive glitches.
FOMO (Fear Of Missing Out) drives us to buy assets that have already doubled in price because "everyone else is getting rich."
Recency Bias convinces us that the future will look exactly like the immediate past.
If the market has been up for three years, we assume it will go up forever.
Confirmation Bias makes us seek out only the news and "gurus" who agree with our current position, ignoring all warning signs to the contrary.
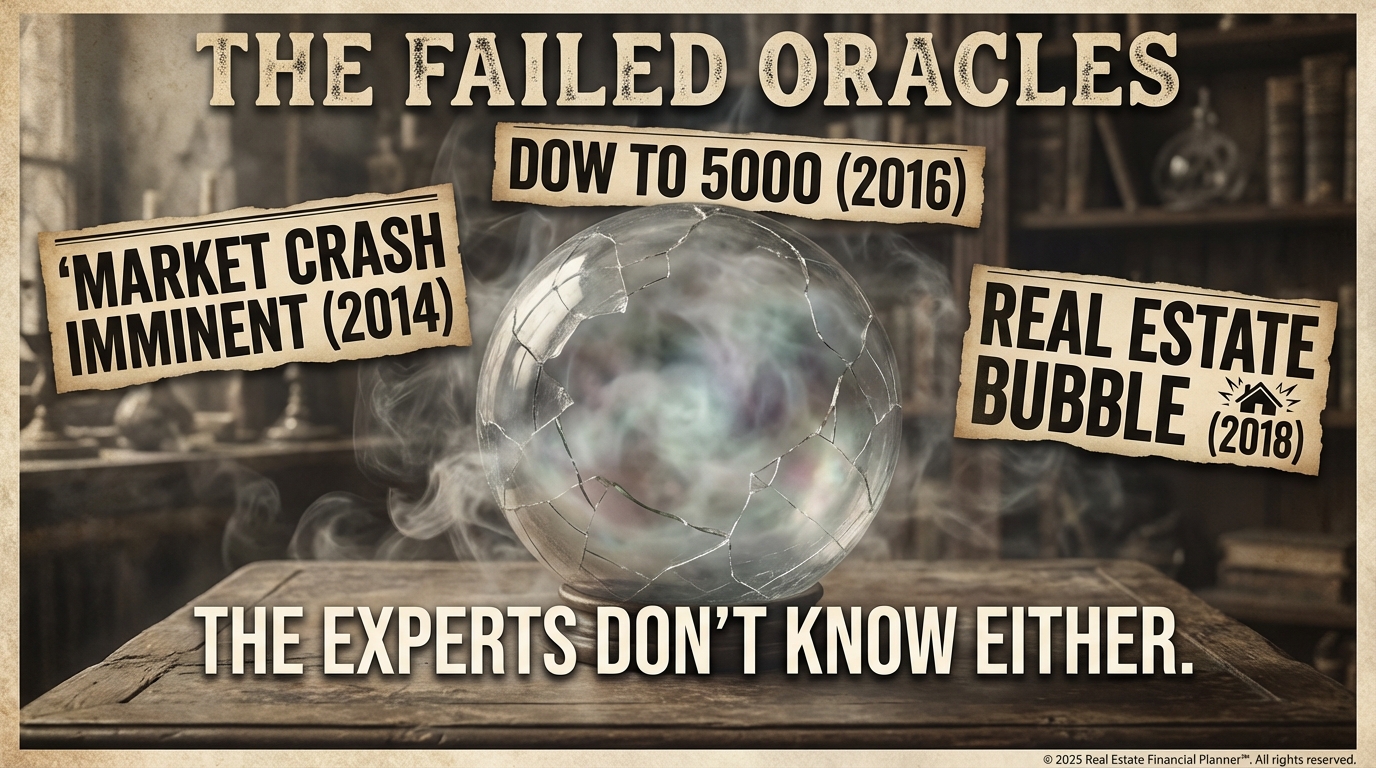
The "Crystal Ball" Fallacy
We desperately want to believe that someone knows what is going to happen.
We tune into CNBC or read detailed forecasts from major banks.
But the data is clear: "Expert" predictions are rarely better than a coin flip.
I have seen famous economists predict "imminent" recessions every single year for a decade.
Eventually, they are right, and they claim victory.
But if you listened to them for the nine years they were wrong, you missed out on massive growth.
Nobody has a crystal ball.
Do not base your financial future on someone else's guess.
Alternatives & Hybrids
So, if perfect market timing is impossible and human emotion is a liability, what should we do?
We need a strategy that removes the guesswork.
We need a system that forces us to do the right thing, even when our gut tells us otherwise.
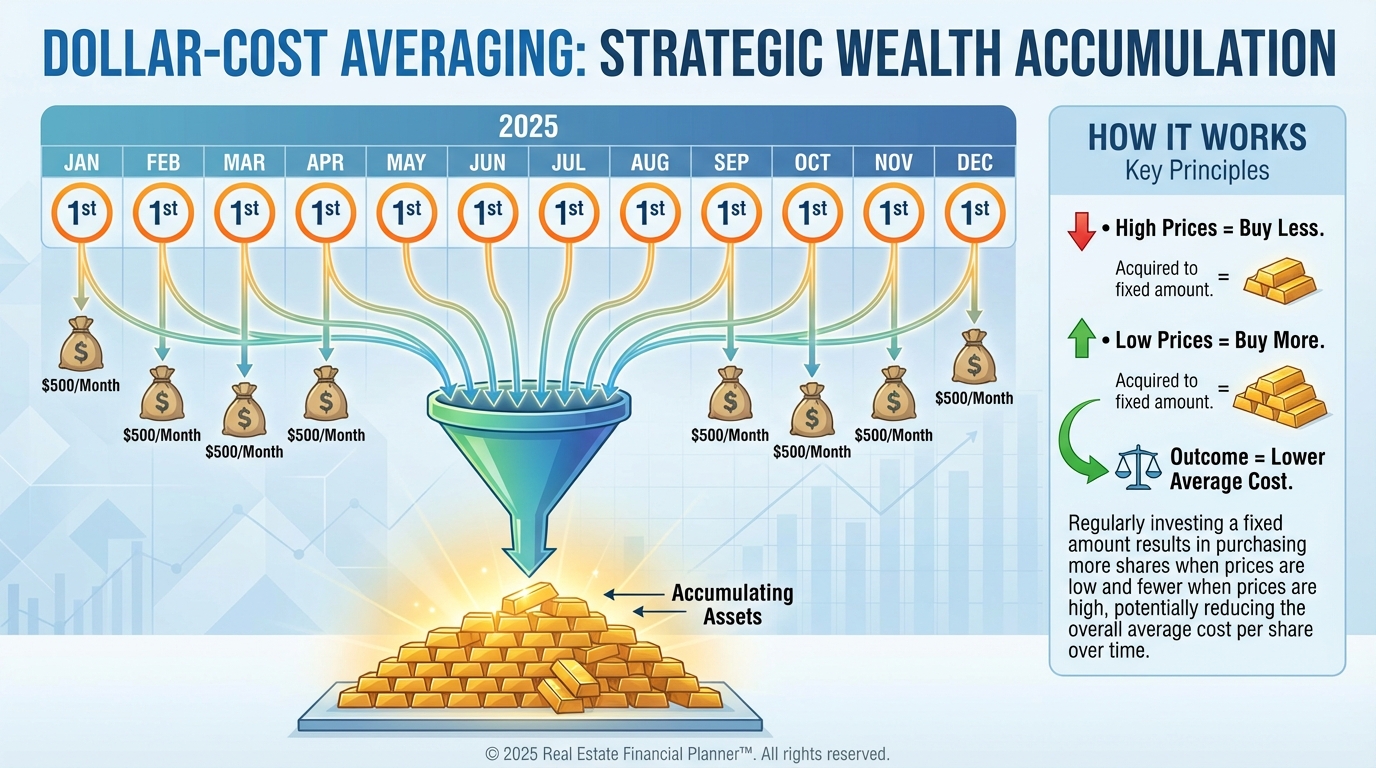
Dollar-Cost Averaging (DCA)
This is the ultimate anti-timing strategy.
Instead of trying to pick the perfect moment, you invest a fixed amount of money at regular intervals.
It doesn't matter if the market is up, down, or sideways.
When prices are high, your fixed amount buys fewer shares.
When prices are low, your fixed amount buys more shares.
Mathematically, this lowers your average cost per share over time.
It completely removes the "should I buy now?" anxiety from your life.
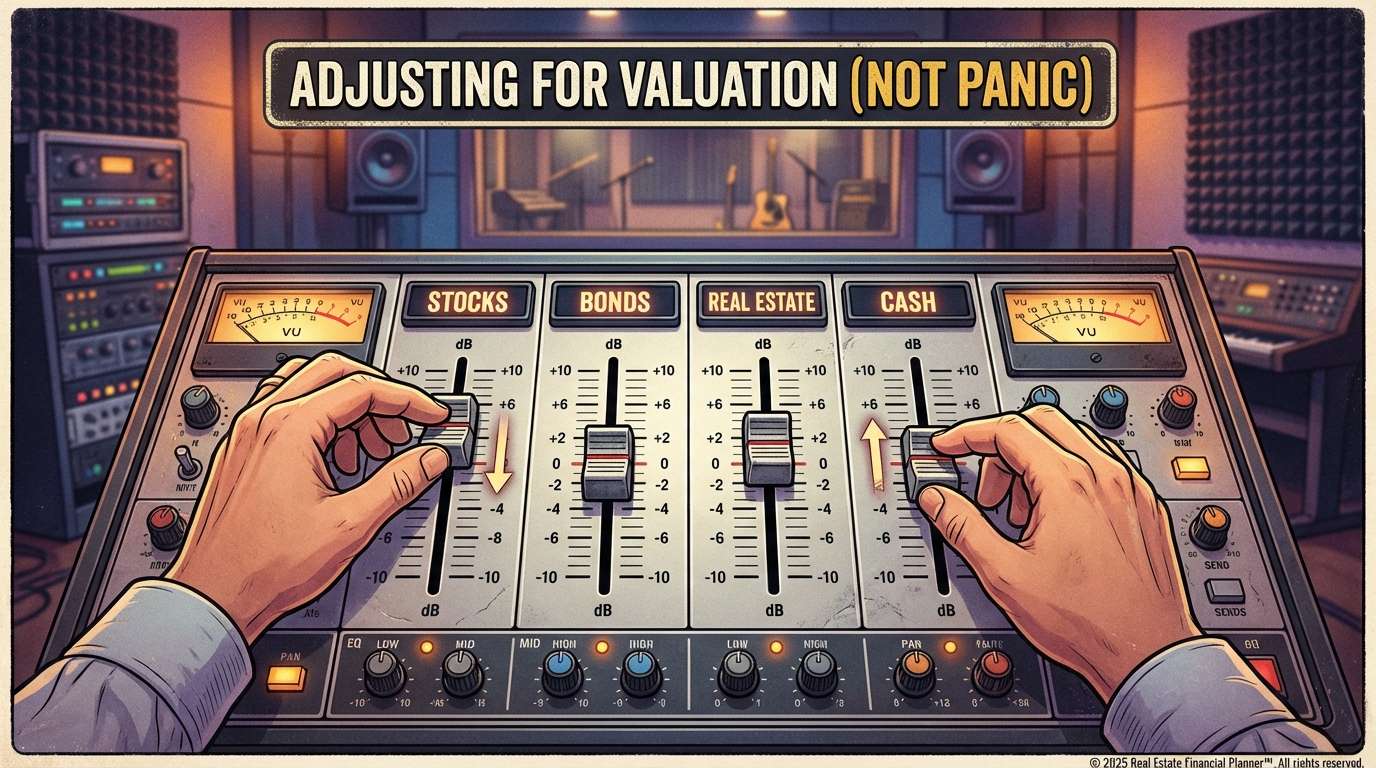
Tactical Asset Allocation
If you still want to exercise some control without going "all in" or "all out," consider Tactical Asset Allocation.
This is a middle ground.
You stick to a core long-term plan, but you make small adjustments based on valuations.
For example, if your target is 60% stocks and 40% bonds.
If the P/E ratio hits historic highs, you might shift to 50% stocks and 50% bonds.
You are not exiting the market; you are just taking a few chips off the table.
You are tilting the odds slightly in your favor without risking being totally out of the game during a rally.
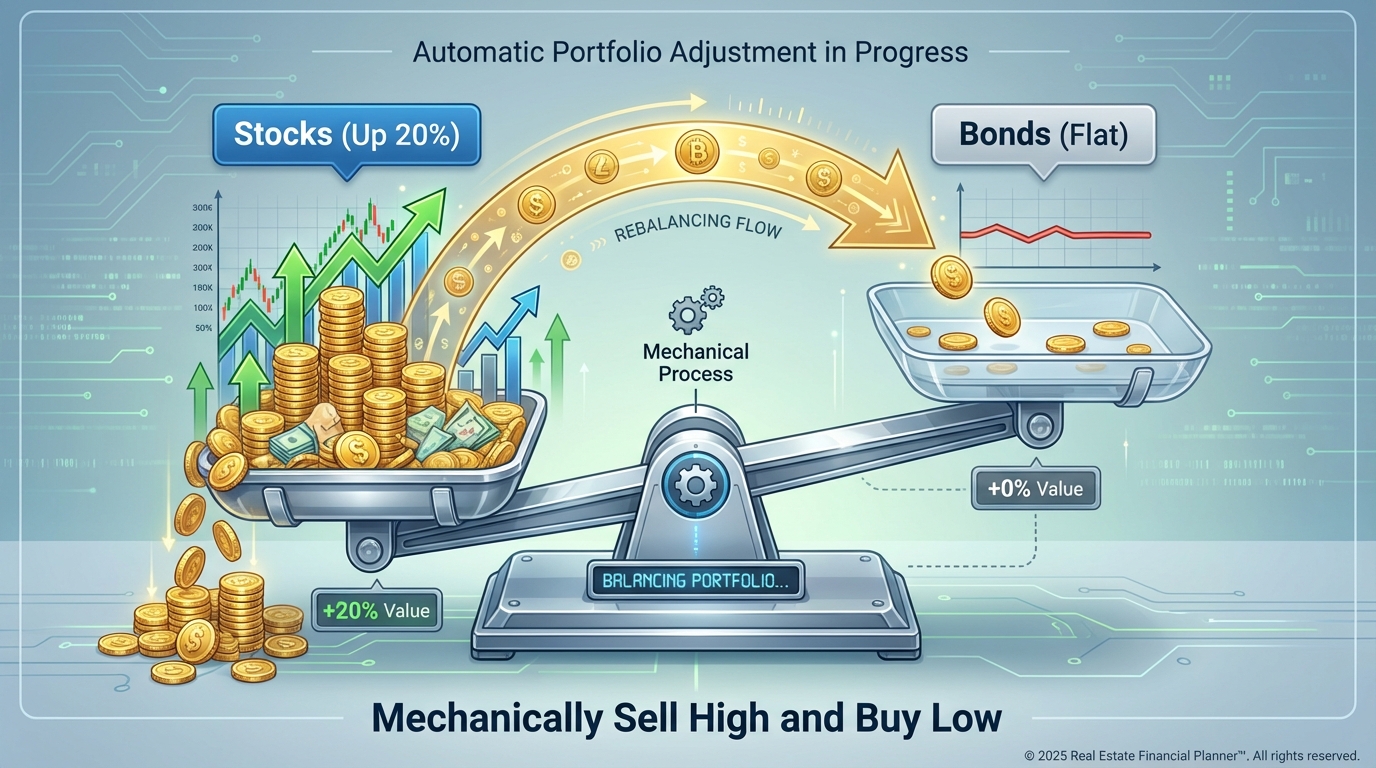
Rebalancing as Natural Timing
This is my personal favorite because it forces you to "buy low and sell high" automatically.
Let's say you want a portfolio of 50% Stocks and 50% Real Estate.
Suddenly, the stock market rips higher, and now your portfolio is 60% Stocks and 40% Real Estate.
To get back to your target, you must sell some stocks (selling high) and buy more real estate (buying low).
You don't do it because you predict a crash.
You do it because the math of your system demands it.
It is a disciplined, unemotional way to harvest profits and reinvest them into undervalued assets.
Conclusion
Market timing is the siren song of investing.
It sounds beautiful, but it often leads to shipwrecks.
While macro indicators and valuation metrics can give us clues, the future remains persistently uncertain.
The best investors don't rely on predicting the weather.
They build an ark that can survive any storm.
Focus on time in the market, manage your risk through asset allocation, and let the magic of compounding do the heavy lifting.