Return on Investment in Real Estate: The Four-Quadrant Method to Maximize True Net Equity and Avoid Bad Deals
Learn about Return on Investment for real estate investing.
The ROI Miscalculation That Quietly Kills Wealth
When I audit portfolios, I usually find ROI calculated on hope and headline numbers.
The fix is precise, not complicated.
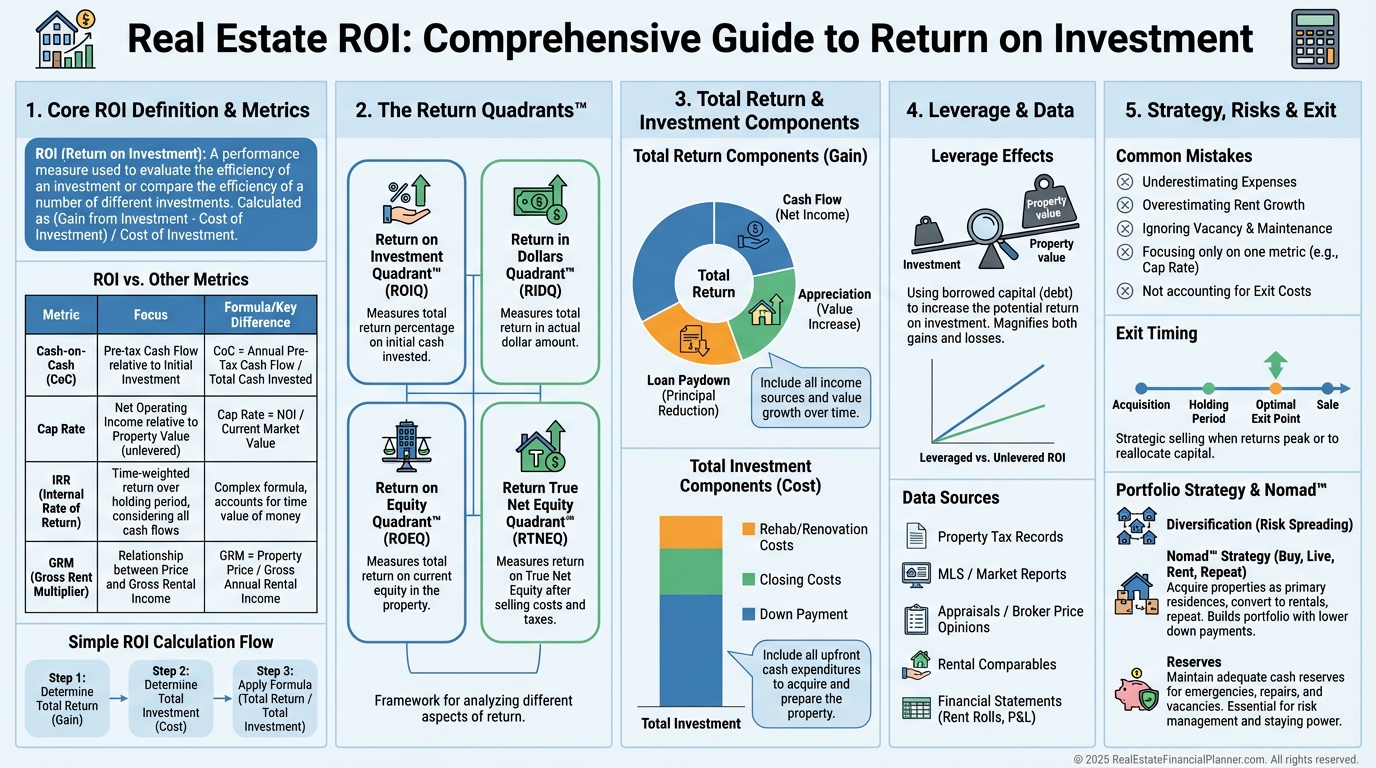
We use the Return Quadrants™ to see the whole picture and True Net Equity™ to know what you actually own after costs and taxes.
What Return on Investment Really Means
Return on Investment measures total profit divided by total invested capital.
It’s the full journey from purchase to sale, not a snapshot.
ROI = (Total Return − Total Investment) / Total Investment × 100.
The math is easy.
Defining “Total Return” and “Total Investment” correctly is where most investors slip.
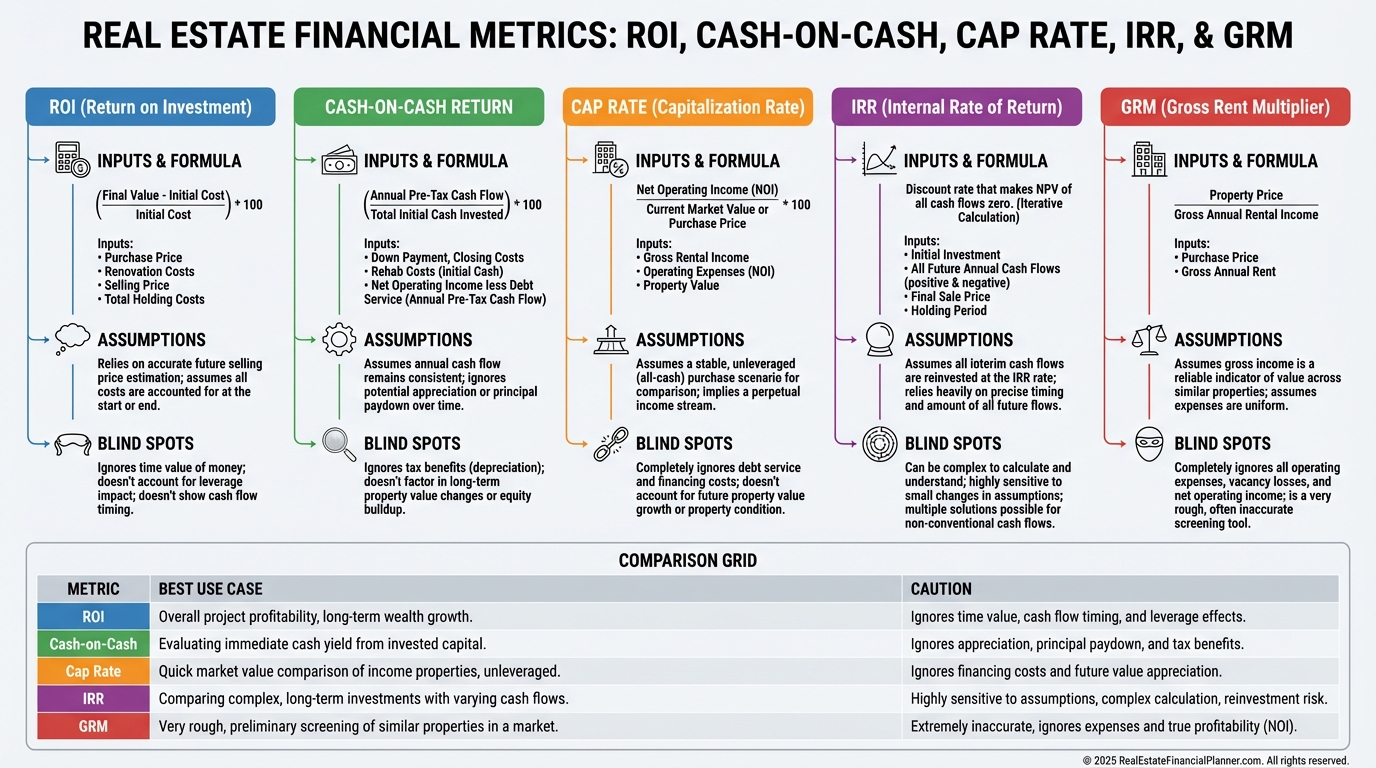
ROI vs Similar Metrics
Cash-on-Cash measures cash income on cash invested.
It ignores appreciation and debt paydown.
It’s fine for property-to-property comparisons, not for your personal returns.
It’s powerful but assumption-heavy.
GRM is fast screening.
It misses expenses, financing, and appreciation entirely.
ROI sits between them.
It’s comprehensive enough to guide strategy and simple enough to use every day.
When I help clients, we triangulate with ROI, Cash-on-Cash, IRR, and Cap Rate so no single metric misleads us.
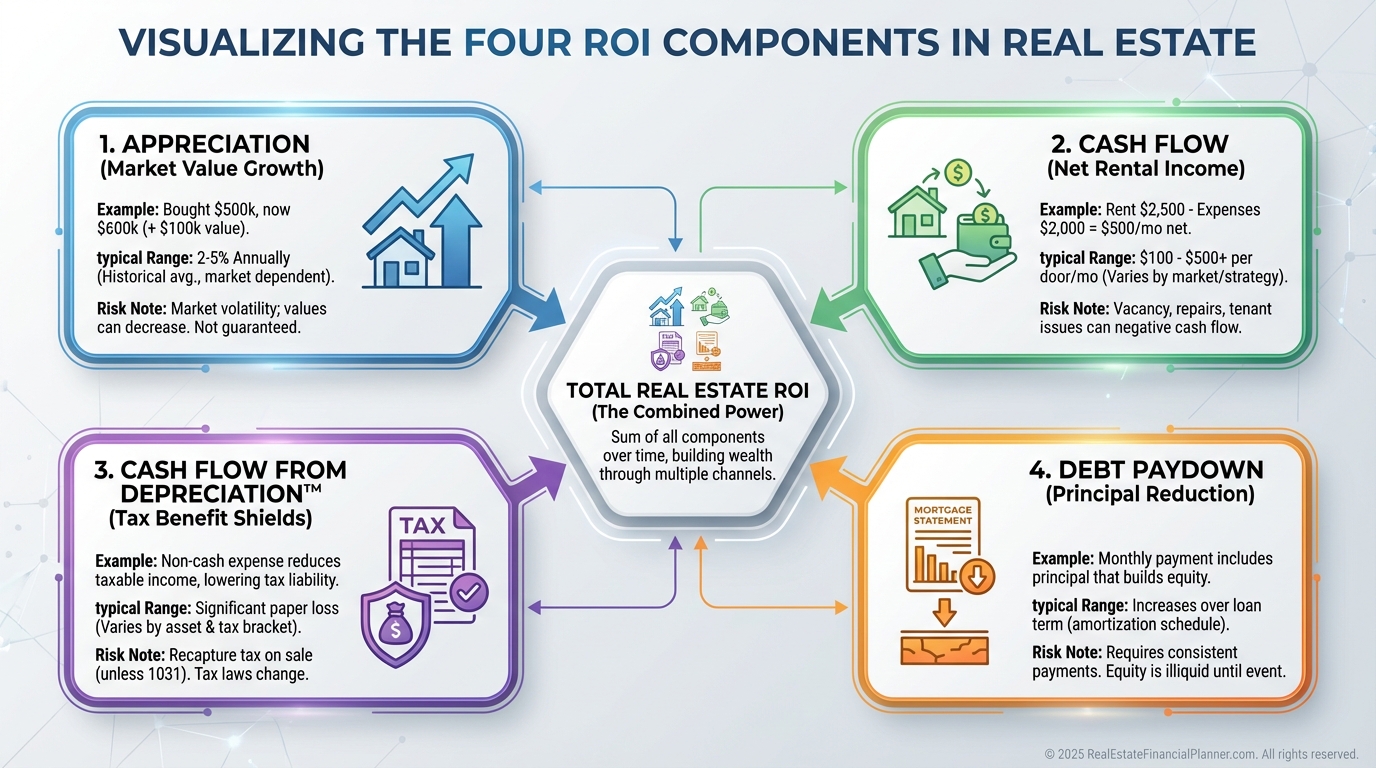
The Return on Investment Quadrant™
Professionals break ROI into four components so we can tune each lever.
Appreciation grows value.
Cash Flow pays you now.
Depreciation (Cash Flow from Depreciation™) delivers tax-driven cash.
I model each quadrant separately in The World’s Greatest Real Estate Deal Analysis Spreadsheet™ and then sum them to total ROI.
Calculating ROI Like a Pro
We start with two buckets: Total Return and Total Investment.
Every dollar in or out must land in one of them.
No exceptions.
Breaking Down Total Return Using the Return in Dollars Quadrant™
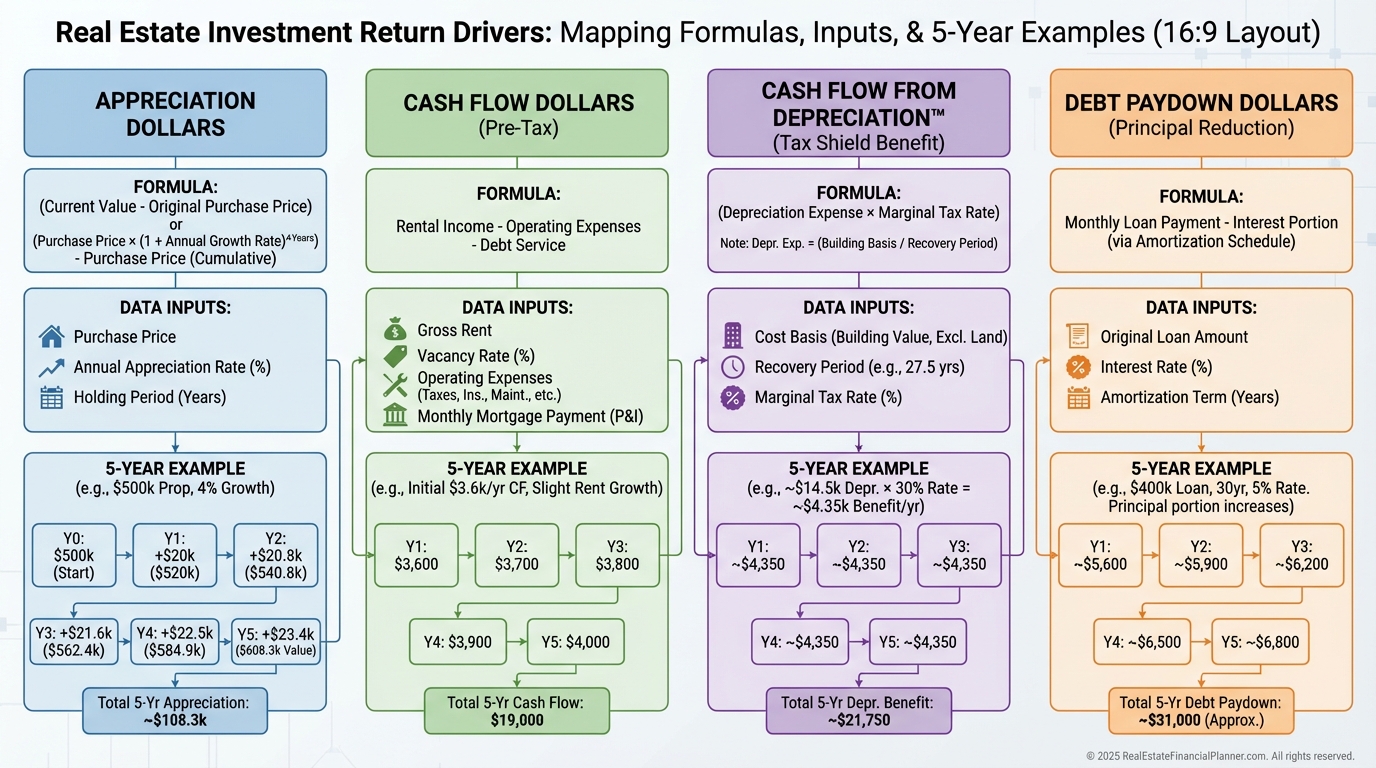
Appreciation Dollars come from market growth and improvements.
Use conservative rates: 2–4% depending on market history.
Cash Flow Dollars are cumulative net rent after all operating expenses and mortgage.
Track actual cash, not pro forma.
Depreciation Dollars (Cash Flow from Depreciation™) convert allowable depreciation into cash via tax savings.
Calculate residential building basis (often 80% of price, land excluded) divided by 27.5 years, then multiply by your tax rate.
Debt Paydown Dollars are cumulative principal reduction over the hold.
It is silent but often 20–30% of total return.
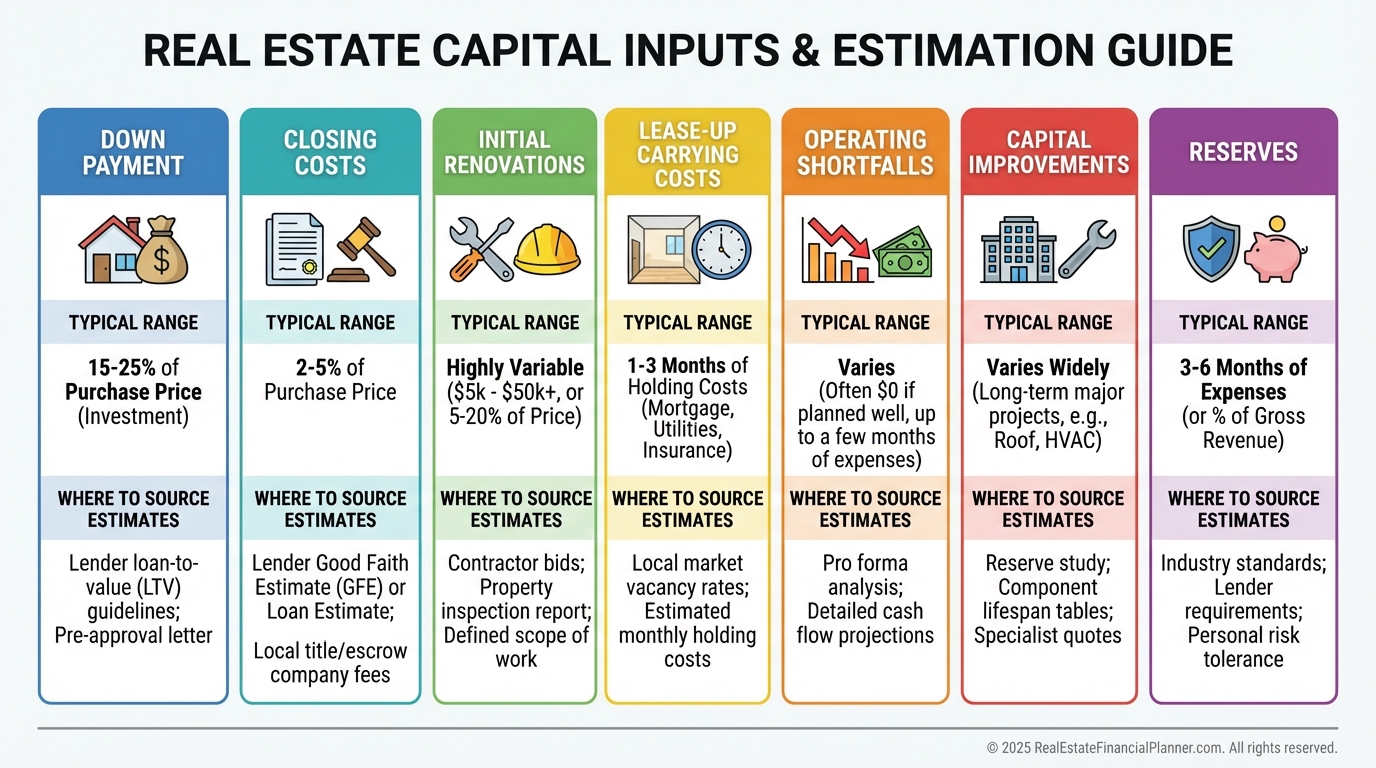
Breaking Down Total Investment
Down payment is only the start.
Include closing costs, initial renovations, vacancy and carrying costs during lease-up, operating shortfalls, and capital improvements over the hold.
When I rebuilt after a bad flip early in my career, I stopped “forgetting” turn costs and vacancy.
My ROI doubled simply by buying with the full capital stack in mind.
Real-World ROI Example
David buys a duplex for $200,000.
Five-year hold.
Total Investment:
•
Down payment (25%): $50,000
•
Closing costs: $6,000
•
Initial renovations: $15,000
•
Carrying costs (3 months): $4,500
•
New roof in year 3: $8,000
Total Investment: $83,500
Total Return:
•
Cash Flow: $24,000
•
Appreciation (3%/yr): $32,000
•
Cash Flow from Depreciation™ (24% bracket): $15,000
•
Debt Paydown: $19,000
•
Selling costs: −$14,000
Total Return: $76,000
ROI = $76,000 / $83,500 × 100 = 91% over five years.
Roughly 13.8% annualized.
This is why the full quadrant view matters.
Data Sources That Keep You Honest
For rent, cross-check Rentometer, Zillow Rental Manager, Apartments.com, and three local property managers.
Use the conservative average.
For expenses, start with the 50% rule and replace it with vendor quotes and manager actuals.
For appreciation, pull FHFA HPI 10-year metro data and cap at 4%.
For depreciation, follow IRS Pub 527 and ask your CPA about cost segregation and bonus opportunities.
How ROI Shapes Pricing, Leverage, and Exits
When I price offers, I underwrite the same property three ways: unlevered, leveraged, and True Net Equity™ after hypothetical exit.
This reveals where the value really comes from.
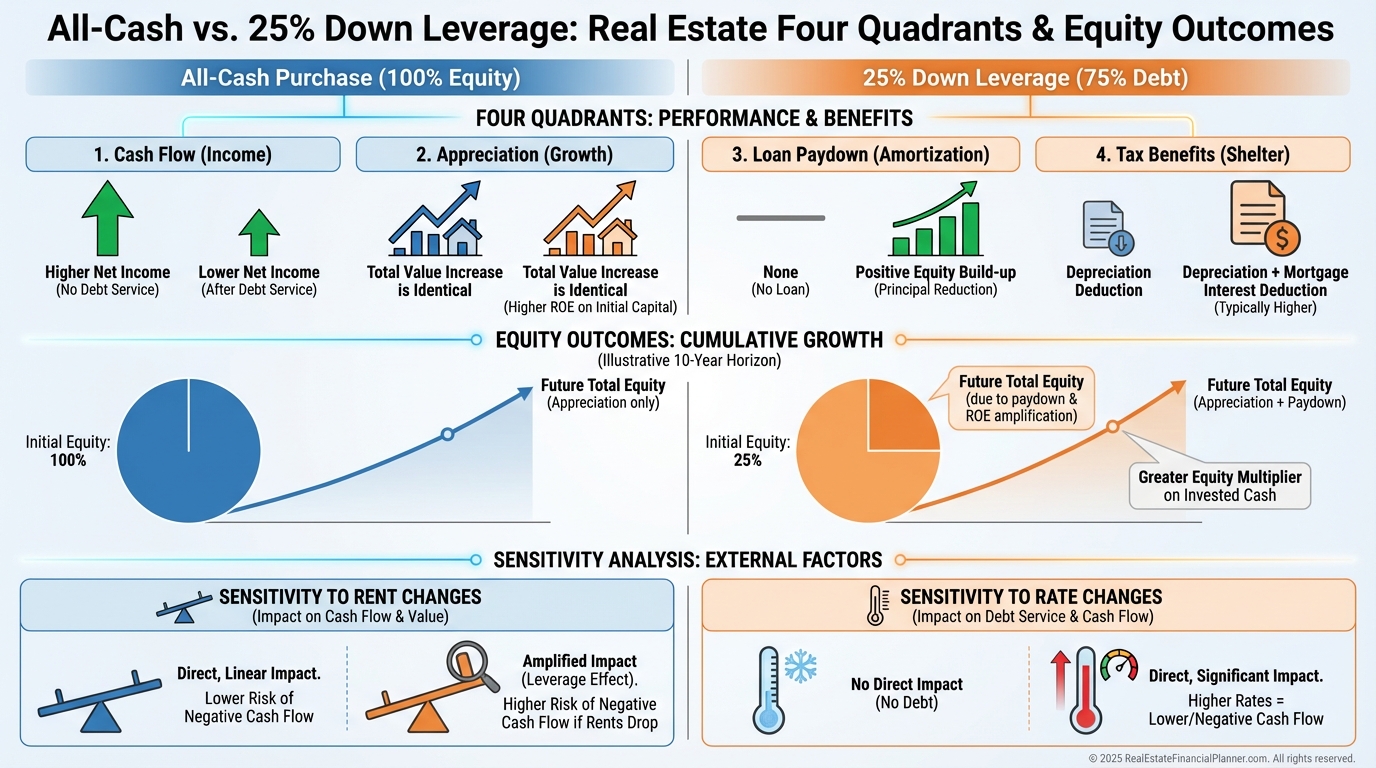
The Return on Equity Quadrant™ and Leverage
Return on Equity shows performance on your actual equity at risk.
Leverage can amplify every quadrant, but it also magnifies mistakes.
Maria invests $100,000.
All-cash, she buys one $100,000 property and earns 35% over five years.
Leveraged at 25% down, she controls four properties and sees 140% over five years on the same property-level results.
That’s the power—and the risk—of leverage.
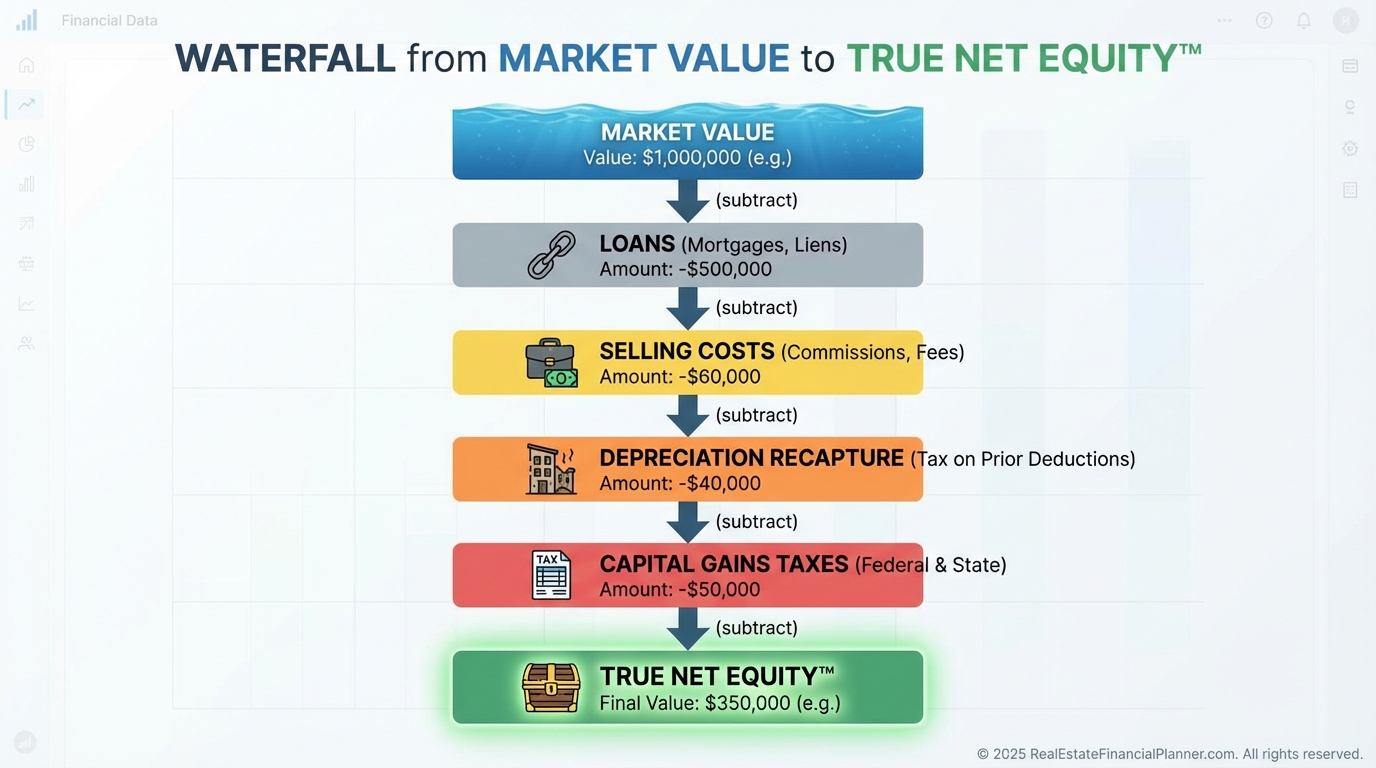
Return True Net Equity Quadrant™ — The Reality Check
Paper equity is not spendable.
True Net Equity™ subtracts selling costs, depreciation recapture, and capital gains taxes.
It’s what you can actually redeploy.
I’ve seen “140% ROE” shrink to “95% True Net Equity ROE” after taxes and commissions.
Still excellent, but now you’re making decisions with eyes open.
Portfolio-Level Strategy With Quadrants
Use quadrant targets to align deals to goals.
Need income now?
Favor stronger Cash Flow with stable markets.
Building long-term wealth?
Prioritize Appreciation and Debt Paydown with prudent leverage.
High W-2 income?
Use cost segregation to front-load Cash Flow from Depreciation™.
Common ROI Mistakes I See Every Week
Investors ignore Cash Flow from Depreciation™ and understate returns 15–20%.
They miscalculate Debt Paydown by using the starting balance instead of cumulative principal reduction.
They double-count by adding gross rent and Cash Flow.
They forget reserves, which inflates returns on paper while increasing risk in real life.
They compare 3-year returns to 7-year returns and draw false conclusions.
They assume best-case for all quadrants at once.
I force a “Most Likely” case with stress tests on rent, vacancy, and rates.
Case Study: The Quadrant Analysis Difference
Marcus buys a fourplex for $300,000.
His traditional ROI said 40%.
Our quadrant analysis said 32% after reserves and selling costs.
Cash Flow after reserves: $35,000.
Appreciation: $50,000.
Cash Flow from Depreciation™: $21,000.
Debt Paydown: $30,000.
Selling costs: −$24,000.
Actual Total Return: $112,000.
True beats optimistic every time.
Strategic Applications You Can Use Today
The Investment Decision Framework
Set minimum quadrant thresholds.
An income-focused profile might weight 40% Cash Flow, 20% Appreciation, 20% Cash Flow from Depreciation™, 20% Debt Paydown.
A wealth-building profile might weight 15% Cash Flow, 45% Appreciation, 15% Cash Flow from Depreciation™, 25% Debt Paydown.
I write these as pre-commitments and let the math veto FOMO.
Value-Add ROI Done Right
Before renovating, I map the lift into all four quadrants.
A $15,000 kitchen that adds $200/month in net rent over 60 months yields $12,000 in Cash Flow.
If buyers value it at $20,000 more today, that’s immediate Appreciation.
Add new depreciation for eligible components and support safer leverage.
Total lift often exceeds 100% ROI on renovation when underwritten correctly.
Exit Timing With Return True Net Equity Quadrant™
Years 1–2 usually have negative net after selling costs.
Years 3–5 are often the sweet spot as all quadrants contribute.
Years 5–7 see depreciation benefits fade relative to basis.
Past year 7, consider a 1031 or Nomad™-style repositioning to keep compounding and manage taxes.
When I help clients decide, we compare ROE today vs projected True Net Equity™ redeployed ROE next year.
If the spread is meaningful after taxes and costs, we move.
Advanced Portfolio Strategies
Balance quadrants across properties so your portfolio meets your target blend, not just each deal.
Run Return on Investment Quadrant™ plus 6-month reserves to show durable, not fragile, returns.
Coordinate tax timing with your CPA to maximize Cash Flow from Depreciation™ and minimize recapture.
For syndications, translate sponsor pro formas into the four quadrants so you’re comparing apples to apples.
For Nomad™, model phased owner-occupant financing, low-money-down entries, and rent-ready turns to accelerate ROE with less capital.
Putting It All Together
ROI is not the number your spreadsheet shows by default.
It’s the disciplined sum of four returns, the full cost to own, and the reality of exit costs and taxes.
Use the Return on Investment Quadrant™ to evaluate, the Return in Dollars Quadrant™ to measure, the Return on Equity Quadrant™ to monitor, and the Return True Net Equity Quadrant™ to decide.
When you measure what matters with ruthless accuracy, you stop overpaying, you time exits intelligently, and you compound wealth on purpose.
Open your last deal in The World’s Greatest Real Estate Deal Analysis Spreadsheet™.
Add reserves, taxes, selling costs, and all four quadrants.
Then decide your next move with confidence.